


A Gantt chart is a project management tool that illustrates a project plan. It typically includes two sections: the left side outlines a list of tasks, while the right side has a timeline with schedule bars that visualize work. The Gantt chart can also include the start and end dates of tasks, milestones, dependencies between tasks, and assignees. To keep up with the demands of modern software development, roadmap tools like Jira Software include features like a collapsible task structure and resource management panels. These roadmap tools help teams maintain a coherent project strategy despite the iterative nature of the software development process.
Origins of the Gantt chart
In the early part of the 20th century, Henry Gantt revolutionized project management with Gantt charts. At that time, they were written out on pieces of paper. With the rise of computers in the 1980s, Gantt charts became increasingly complex and elaborate. Today, Gantt charts are still one of the most widely used project management tools.
Today, Gantt chart tools are often referred to as roadmap tools. Jira includes two roadmap tools to create Gantt charts for your projects: Roadmaps, which creates plans around Jira issues assigned to a team, and Advanced Roadmaps, which does the same thing across teams and organizations.
Roadmaps
Advanced Roadmaps
What is a Gantt chart used for?
Project managers use Gantt charts for three main reasons:
Build and manage a comprehensive project
Gantt charts visualize the building blocks of a project and organize it into smaller, more manageable tasks. The resulting small tasks are scheduled on the Gantt chart's timeline, along with dependencies between tasks, assignees, and milestones.
Determine logistics and task dependencies
Gantt charts can be employed to keep an eye on the logistics of a project. Task dependencies ensure that a new task can only start once another task is completed. If a task is delayed (it happens to the best of us), then dependent issues are automatically rescheduled. This can be especially useful when planning in a multi-team environment.
Monitor progress of a project
As teams log time towards issues in your plan, you can monitor the health of your projects and make adjustments as necessary. Your Gantt chart can include release dates, milestones, or other important metrics to track your project's progress.
The benefits of using a Gantt chart
There are two main reasons why Gantt charts are loved throughout the project management world. They make it easier to create complicated plans, especially those that involve multiple teams and changing deadlines. Gantt charts help teams to plan work around deadlines and properly allocate resources.
Projects planners also use Gantt charts to maintain a bird's eye view of projects. They depict, among other things, the relationship between the start and end dates of tasks, milestones, and dependent tasks. Modern Gantt chart programs such as Jira Software with Roadmaps and Advanced Roadmaps synthesize information and illustrate how choices impact deadlines.
Gantt charts in waterfall vs. agile planning
Gantt charts can be a powerful tool for both the waterfall or agile methodologies.
Waterfall
The waterfall model of project planning follows a linear approach where stakeholder and customer requirements are collected at the beginning of the project. From that, project managers create a sequential project plan, complete with milestones and deadlines. Every piece of the project relies on the completion of preceding tasks. This is favored by teams that focus on process (such as construction or manufacturing) and less on ideation or problem-solving as the steps need to be planned out in advance.
Gantt charts are typically preferred by project managers using waterfall. They determine a project schedule by breaking projects into manageable chunks of work and assigning start and end dates. It's also helpful in identifying important milestones in your project. Milestones are accomplishments that teams should achieve on or ahead of schedule. They are optional but recommended.
Agile
On the other hand, the agile model of project planning values flexibility and adaptability. Instead of creating a full timeline with set dates, agile teams break projects into smaller iterations (also known as sprints). At the beginning of a sprint, a team plans their work against the goals of the project over the course of the next two weeks. Once that sprint is over, the accomplishments and developments from it help to create the plan for the next sprint.
A Gantt chart can show how changing one task has the potential to impact the plan or the product roadmap. For agile teams, this is essential since stakeholder feedback is a large part of the methodology.
Using Gantt charts
Gantt charts remain an important project management tool throughout various industries. At the end of the second decade of the 21st century, the Project Management Institute concluded that a mere 11 percent of organizations were fully agile. Most organizations employ waterfall project management methodologies (usually at higher management level) in addition to agile methodology. This is called a hybrid approach. If you happen to think in 'dates and deadlines' then you're probably among those that need timeline-based Gantt charts.
Jira Software comes with two different roadmapping features, each with a slightly different focus. Jira Roadmaps is designed to track work assigned to a single team while Advanced Roadmaps is designed for larger, cross-organization project planning.
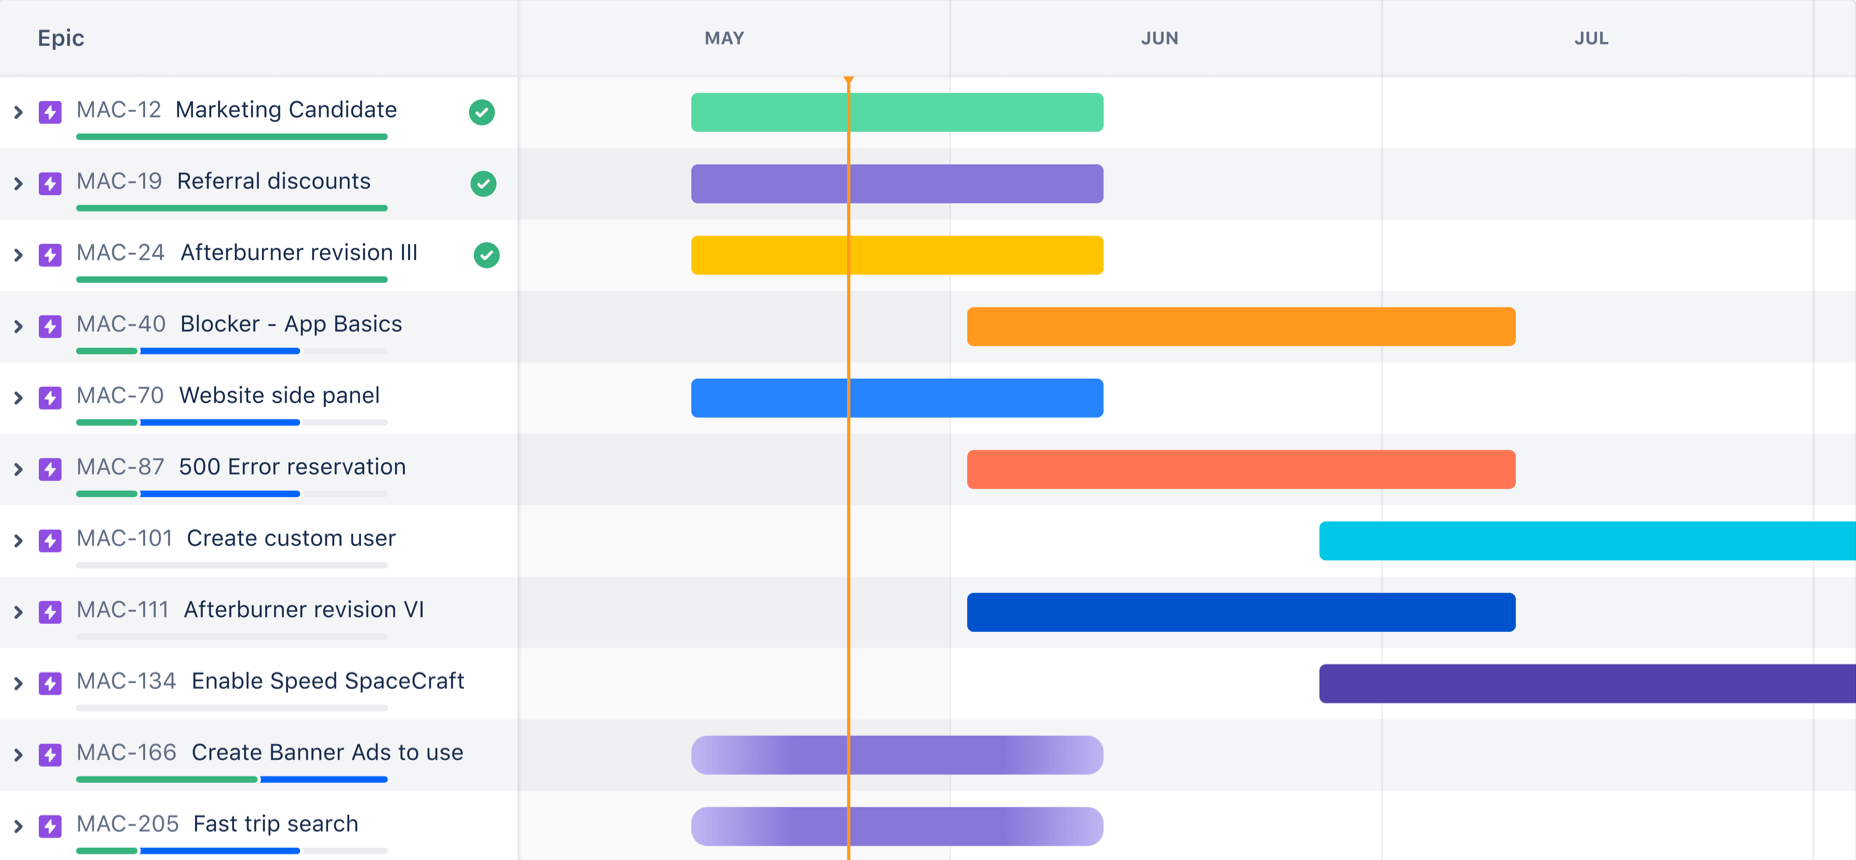
Project-specific charts - Jira Roadmaps
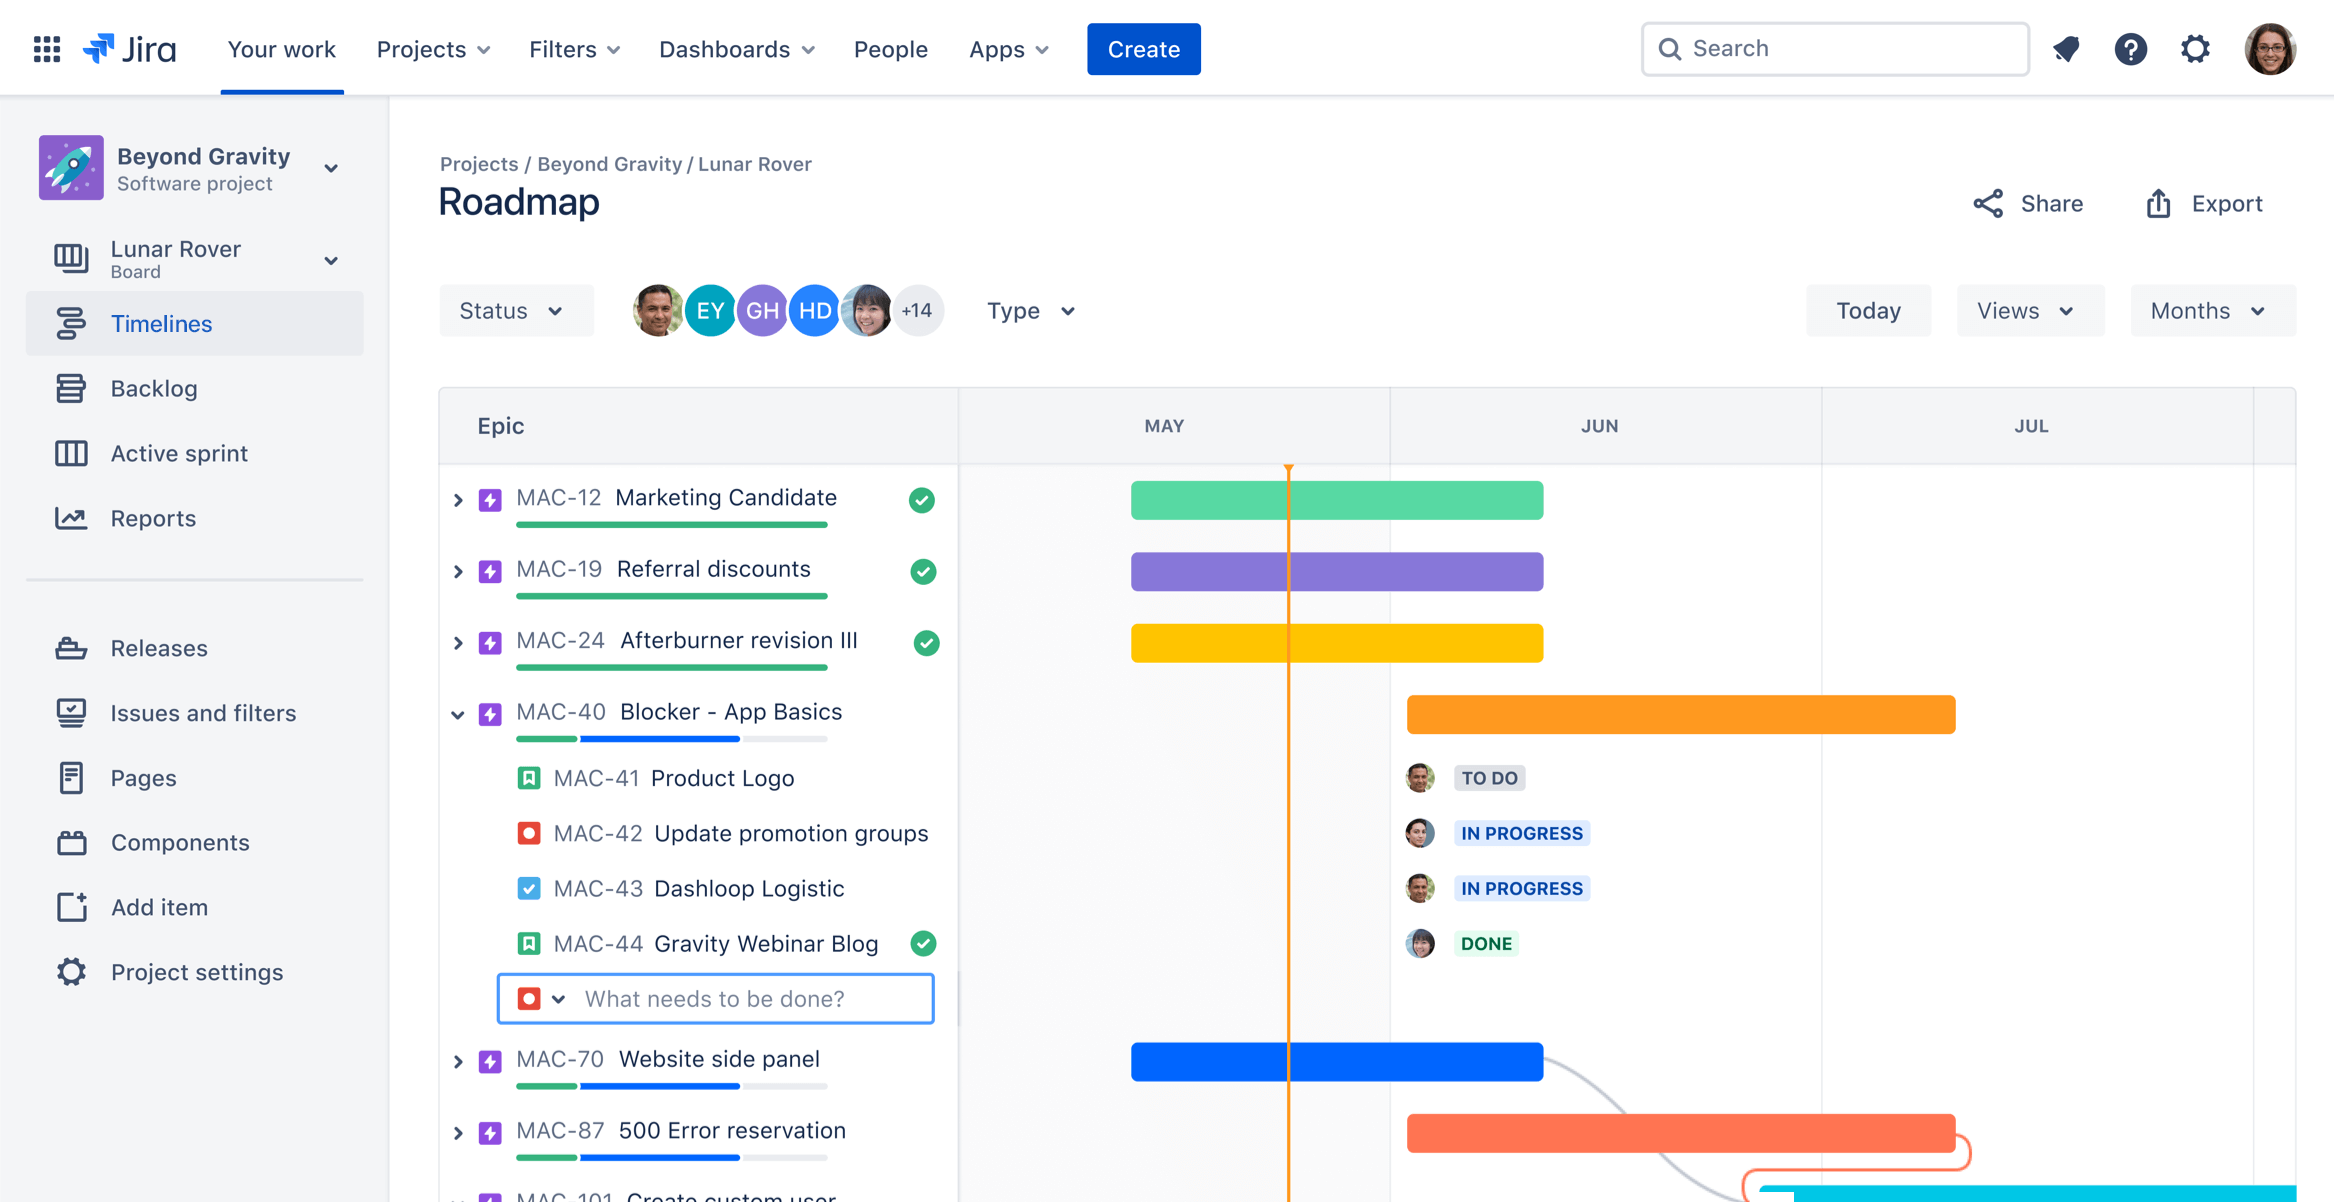
The screenshot above, taken from Roadmaps, shows a project-specific Gantt chart which is commonly used at the team level or within a single department. The chart shows how the team is tracking toward their goals, and the collapsible work breakdown structure allows project managers to get a bird's eye view on the crucial stories of the project.
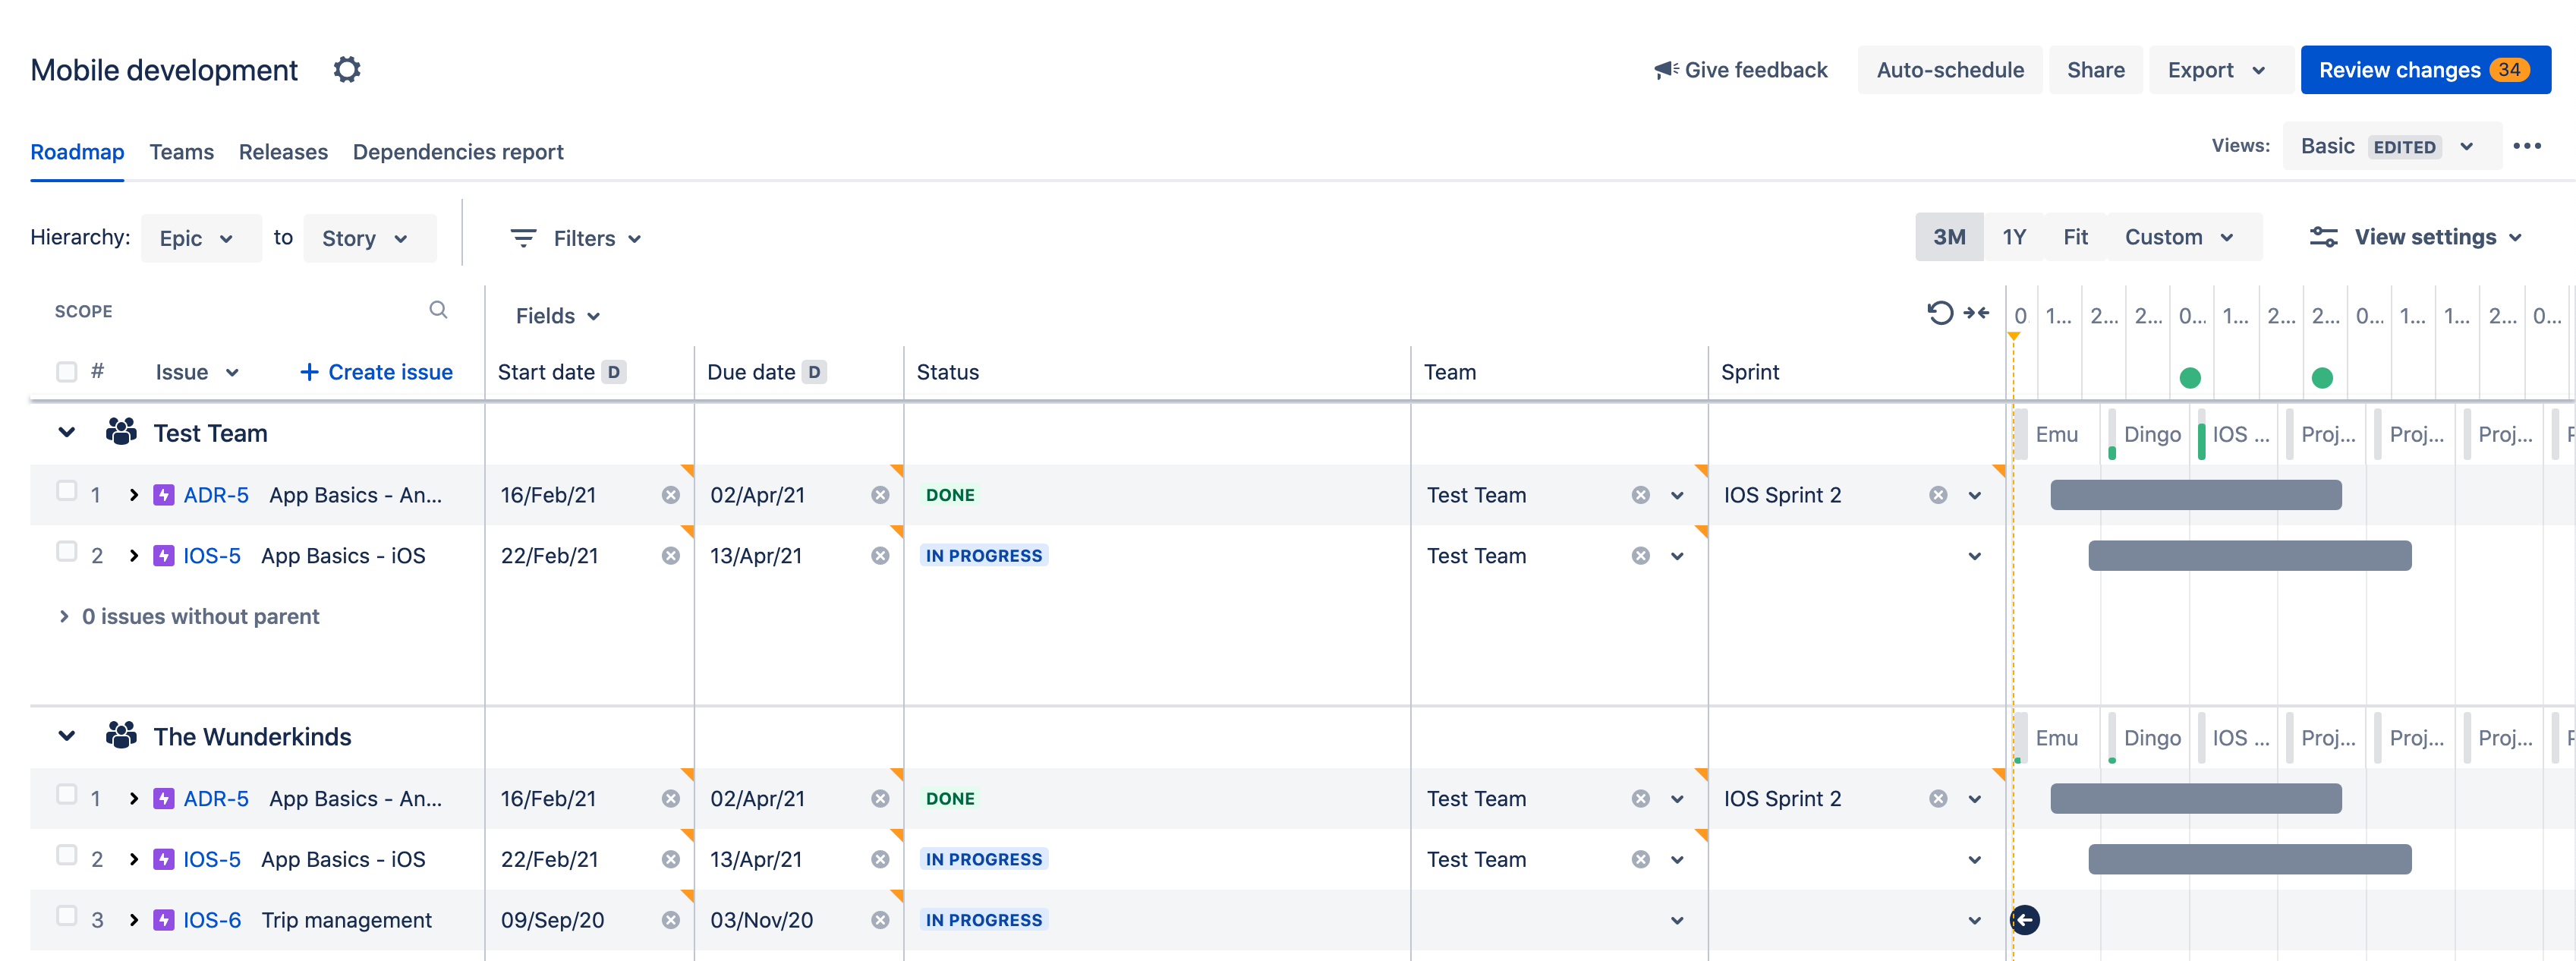
High-level organization chart - Advanced Roadmaps
Roadmaps offers quick and easy planning that helps teams better manage their dependencies and track progress on the big picture in real-time. These project or team-level roadmaps are useful for team-level planning of large pieces of work.
For planning, managing, and tracking work across multiple teams or even your entire organization, Advanced Roadmaps empower teams at scale.
Programs designed with cross-team workflows offer more advanced tools like capacity management and automatic scheduling features to help create more complex plans. They also offer a variety of view settings to allow you to customize your Gantt chart to highlight a certain aspect of your plan when presenting.
In conclusion...
Modern Gantt chart software like Jira Software with Roadmaps and Advanced Roadmaps are used by project managers and industry leaders to help organizations meet their goals. Whether planning a complex project or monitoring your company's progress, Gantt chart tools like these are scalable and equally applicable to the portfolio, large solution, program, and team levels, as per SAFe® guidelines.
Learn more about how Roadmaps and Advanced Roadmaps can help you plan your next project. Start your free trial of Jira Software Cloud today!


